İnsan odaklı projelerimizle
güvenle ilerliyoruz.
Marus Yapı
Marus Yapı, 1971 yılından bu yana inşaat sektöründe uzmanlaşmış, köklü bir geçmişe ve sağlam bir itibara sahip bir marka olarak faaliyet göstermektedir. Yarım asrı aşan tecrübesiyle sektörde güvenin ve kalitenin adresi olmayı başaran Marus Yapı, yenilikçi mühendislik çözümleri ve ileri teknolojiyi bir araya getirerek fark yaratan projelere imza atmaktadır.
Marus Yapı, kullanıcı odaklı tasarım anlayışıyla, hem bireylerin hem de şehrin ihtiyaçlarına yönelik çözümler üretir. Bu yaklaşım, sadece bir yaşam alanı sunmanın ötesine geçerek, değer katan ve memnuniyet sağlayan yapılar ortaya çıkarmasını mümkün kılar. Geleceğe yönelik vizyonu ile Marus Yapı, inşaat sektöründe öncü olma misyonunu sürdürmekte ve her geçen gün daha da büyüyerek gelişimini devam ettirmektedir.

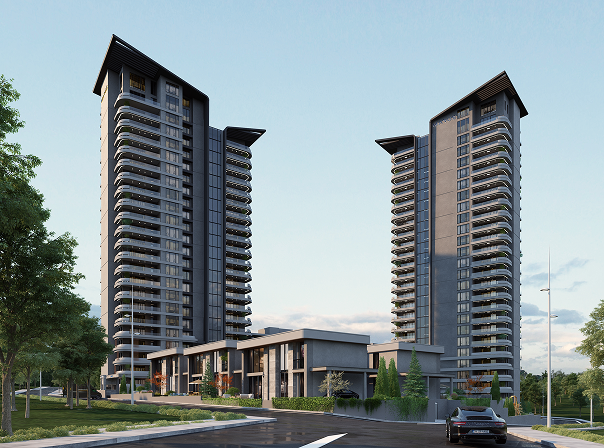
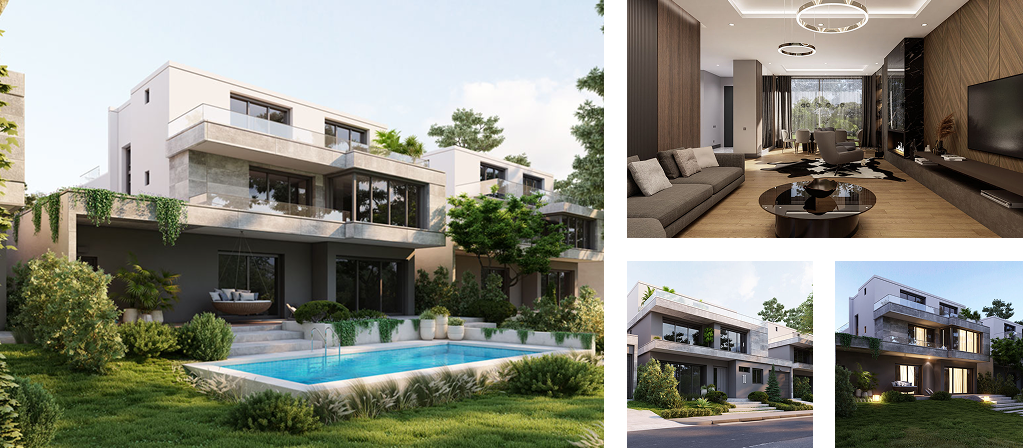
Ankara'nın seçkin üniversiteleri Hacettepe, Bilkent ve ODTÜ'nün ortasında, orman arazisiyle çevrili huzurlu bir bölgede konumlanan Marus Bilkent, şehire olan yakınlığıyla hareketli bir sosyal hayatı ve doğayla iç içe olmanın huzurunu bir arada sunuyor.
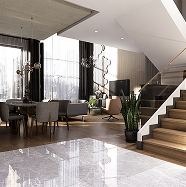
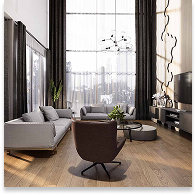
109 daire ve 6 villadan oluşan, toplamda 115 konutluk bu prestijli proje; farklı yaşam tarzlarına uygun 2 çok katlı ve 2 az katlı blok tasarımıyla dikkat çekiyor. Proje, önü kapanmayan geniş yeşil alanları, eşsiz manzarası ve benzersiz mimarisiyle modern yaşamın tüm ihtiyaçlarını karşılıyor.
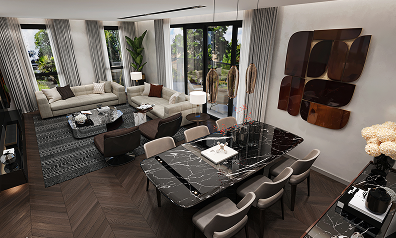
2+1'den 5+1'e kadar uzanan daire seçenekleri, lüks penthouse ve villa alternatifleriyle her detayı özenle planlanmış Marus Bilkent, sınıfının üstünde bir yaşamın kapılarını aralıyor.
PROJE SAYFASINA GİT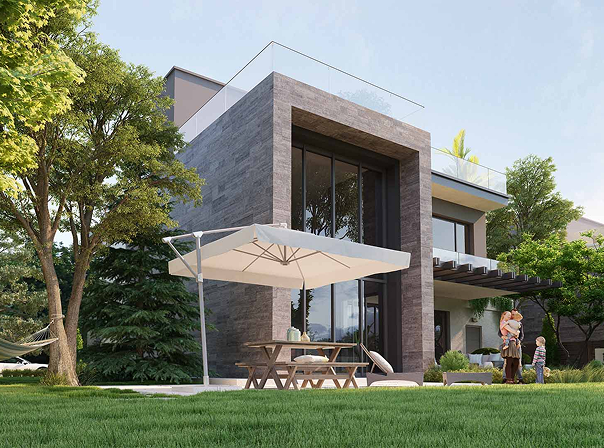
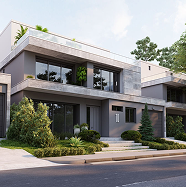
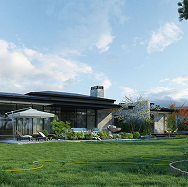
Marus Beytepe, şehrin içinde, kalabalığın dışında eşsiz bir konumda yer alıyor. Doğa ile iç içe, sessiz ve konforlu bir yaşam isteyenler için tasarlanan 12 adet tam mustakil villadan oluşan Marus Beytepe, Ankara'nın en prestijli bölgesi Beytepe'de, 7.800 m² arsa üzerinde konumlanıyor.
PROJE SAYFASINA GİTYuva Kurmak
Bir Sanattır
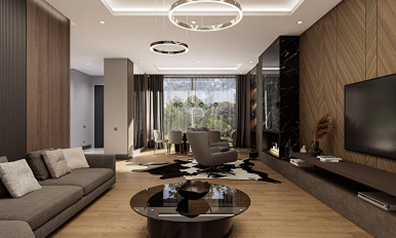


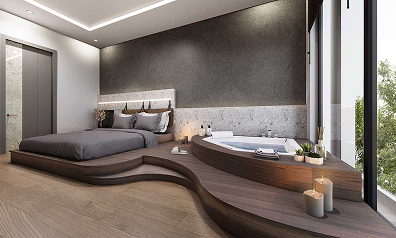
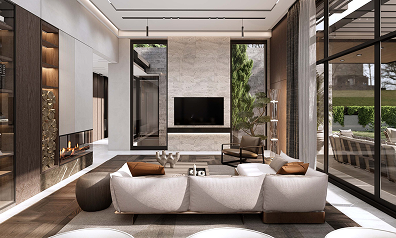
Marus Art Beytepe; her sanat eseri gibi; görkemli, güçlü ve benzersiz. Sanatın gücüyle tasarlanan Marus Art Beytepe hayranlık duygumuzu harekete geçiriyor. Mimarisiyle ve konseptiyle ruhumuza dokunuyor. Her gerçek sanat eseri gibi her geçen gün değerine değer katıyor.
Marus Art Beytepe'de sabahlar kuşların şarkılarıyla aydınlanır. Güneşin sımsıcak renklerini göstererek batmasıyla da Marus Art Beytepe'nin eşsiz akşamları başlar. Doğanın ilhamının yansıdığı 12 eşsiz villada her gün mutluluğa boyanır. Başrolde sizin olduğunuz ve mutlu hikayenizi sizin yazacağınız Marus Art Beytepe'deki yuvanız hayatınızın merkezi olacak.
PROJE SAYFASINA GİT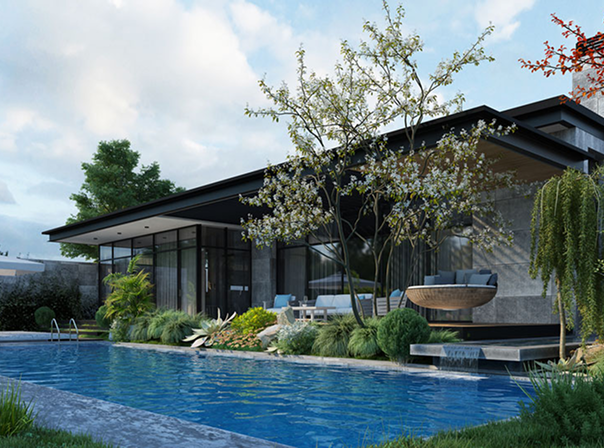

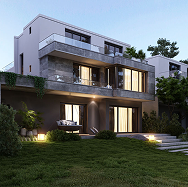
Özlediğiniz Tek Katlı Yaşam Mimarisi ve Konforu Marus İncek Konakları’nda hayat buluyor! Marus İncek Konakları, her biri 1500 m² arsa üzerine konumlanan 8 adet tam müstakil villadan oluşuyor ve 12.000 m² arsa üzerinde konumlanıyor.
PROJE SAYFASINA GİT